
Capacity
The Capacity tab answers one question about size: how much money a strategy can carry on one symbol before its result decays. It is a diagnostic, not a search and not a claim about a whole portfolio.
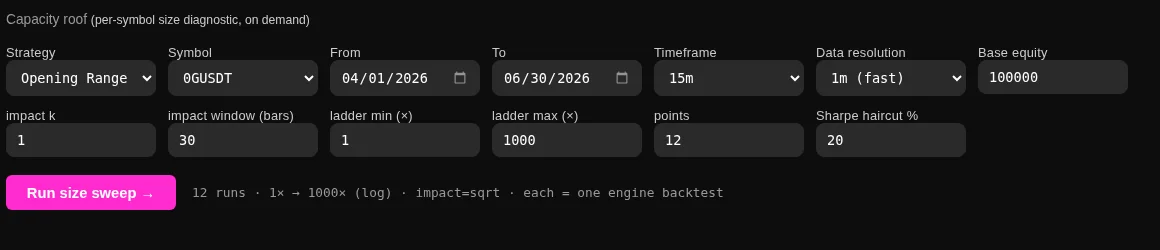
What it runs
One strategy, at its own default parameters, on one window, across a ladder of equity sizes spaced widely apart, from one times to a thousand times a base size. Every step of the ladder runs with square-root market impact switched on, so order size is priced rather than ignored. Each step is a real backtest and lands in the runs store, so any step of the ladder can be opened and compared like any other result.
The roof
From the ladder the tab reads the largest size whose net Sharpe stays within a chosen percentage of the small-size reference, twenty percent by default. The number is drawn on two curves, net Sharpe against size and net return against size, and the roof is the point where the result has decayed by that much.
Equity is the lever here, which means the measurement assumes sizing as a percentage of the balance. A strategy that trades a fixed number of lots does not scale with equity, and the ladder tells you nothing about it.
What it does not say
Market impact prices size. It does not ration liquidity: the simulated fill is still whole, and participation caps and partial fills are not modelled. Tick-level replays get no impact at all, because there is no trailing bar window to measure against.
So read the roof as the point where this symbol stops being free to trade at that size under a square-root impact assumption, and not as the amount a portfolio can hold. A portfolio spreads its size over many coins, and the combination is a different measurement.
Compounding
A run can use the running balance instead of the starting balance, so positions grow as the account grows. With that switch on, impact is enabled whatever the setting says, which is what makes the decay visible on an account that keeps compounding.