
Reading results
A paper fleet is read at three levels: the dashboard for the whole system, the account header for one balance, and the card for one strategy. Each level answers a different question, and the numbers that matter most are the ones that do not agree with each other.
The dashboard
- Running now lists each account that is running something, with its equity, today's P&L, the number of open positions, and the exposure in words once the positions are worth more than the account.
- The tile block under it adds every account together, stopped and test accounts included, which is the number that hides the most.
- Connection health separates the data feed, which is the market tape, from the order feed, which is the path to the venue. Paper shows the data feed only, because paper has no order path to an exchange.
- Errors gathers every instance's error lines into one panel, so an instance that failed an hour ago is not buried in its own tab. A cleared list stays cleared until a genuinely new error arrives.
- Needs attention lists what is not working, worst first: an error, then a feed that lost a span of data, then an instance that is not marking.
The card
For one strategy the card answers whether it is working at all. Today counts closed trades, so it stays at zero while a position is open; Open P&L is the mark on that position, and Since start is the total once the two differ. A card that shows an open position with a green mark and zero trades is a strategy sitting in a trade, not a strategy that has done nothing.
The position and its orders
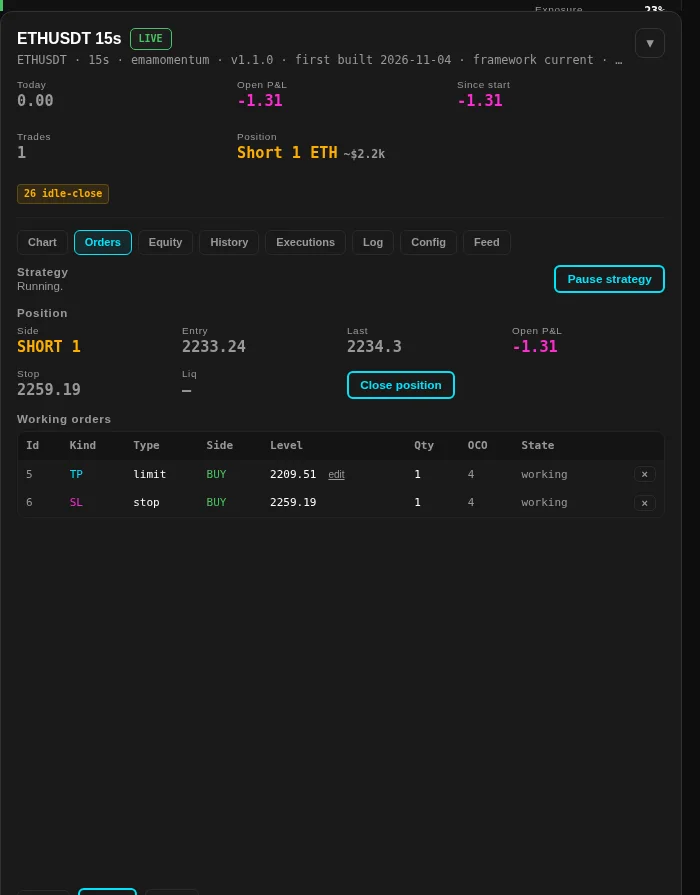
The position block carries the side, the quantity, the average entry, the last price and the open P&L. The stop line is the level the instance would be closed at, and the working orders table says what is actually resting: each order's kind, its side, its level, its quantity, its OCO group and its state.
Two controls sit under it. Close position flattens at the market, which is what you would do by hand, and Pause strategy stops new orders being placed. Pausing leaves the instance running and reading the market, with the stop and the take-profit on the open position exactly where they are.
The curves
The Equity tab draws this instance's equity over time and the History tab draws what it has realized, and they answer different questions. Equity includes what the open position is worth right now, so it moves with the market; realized profit only moves when a trade closes, so it steps. Neither curve smooths anything, and the equity curve marks a restart, because a step at a restart is a gap in the data and not a loss.
A step also appears where you changed a fill setting while instances were running, since everything realized before the change was priced under the old settings. That step has a cause and the instance's log names it.
What a good-looking fleet can hide
The account header's exposure bar and the dashboard's tile block exist for the same reason: members size off the whole balance, so four instances of one strategy deploy four times the per-trade size. A fleet showing a healthy return over a position worth several times the account is a leveraged result, and the header says so in words.
A run that is short a few hours is also not evidence. Paper trading proves that an instance runs, fills, records and reports on the real tape. It cannot prove a strategy is profitable, and it cannot prove what a live venue will give you. Paper versus live says exactly which of the differences a live account would settle.