
Results and statistics
A finished run opens on its own report. Everything on it comes from the trades the run actually took, and the numbers that argue against the strategy are shown with the same weight as the ones that flatter it.
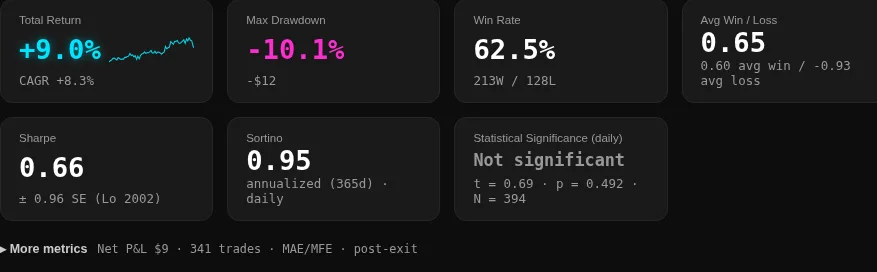
The header
The strategy, the coin, the trading timeframe and the window sit at the top, with the number of sessions the run traded. A badge marks the strategy as a framework strategy or a kit strategy, and the run's own chips say whether it ran on the engine and which regime filter applied.
The headline cards
- Total return with the compound annual growth rate under it.
- Maximum drawdown in percent, and in money on the same card.
- Win rate as a percentage and as wins over losses.
- Avg win / loss in R and in money.
- Profit factor, the gross win over the gross loss.
- Sharpe and Sortino, annualized on a 365-day basis from daily returns. The Sharpe card also carries its standard error, so a Sharpe of 0.66 next to a standard error of 0.96 is read for what it is.
- Statistical significance of the daily returns, with the t value, the p value and the number of days it was computed on.
The R basis switch under the cards decides what 1R is. Planned risk divides each trade by its own risk as it was set up, which is the honest R for a strategy whose stop distance changes. Avg loss uses the average losing trade of the whole run as the stand-in, the older convention. The active basis is named on the card, so a number never floats without one.
The equity curve
The curve is the account over the window. A dashed buy-and-hold reference rides along with it, off by default and one click away, scaled to the strategy's volatility so the two are comparable rather than sized by luck. The chart zooms, pans and switches between a linear and a logarithmic y axis, and hovering gives the drawdown at that point.
The price chart marks every entry and exit, and its hover line names the exit reason with the same labels the trade list uses, see Stops, take-profit and brackets.
The trade list
Every trade carries its side, its entry and exit, its size, its P&L, its R multiple and its exit reason. The list sorts and filters, and a folded row under the cards adds the net P&L, the trade count and MAE and MFE when you want more than the headline set.
What leaves the page
- Trades CSV: every trade, with the fee of each trade.
- Equity CSV: the equity series behind the curve.
- Save as favorite: pins the run so it can be compared with another later.
- Re-run and New backtest: the same settings again, or the form with the window and coin carried over.
- Add coin to portfolio: takes the coin and the strategy into a portfolio run.
What the page refuses to do
A report that looks good and a report that looks bad are laid out the same way, because the same cards come from the same run: a winning set of numbers can sit next to a significance card that refuses to call it significant, and a run that lost money says it lost money. Nothing is smoothed, and no sample is too small to be questioned, since the significance card names the number of days it was computed on.